Psychrometric chart as DXF for CAD
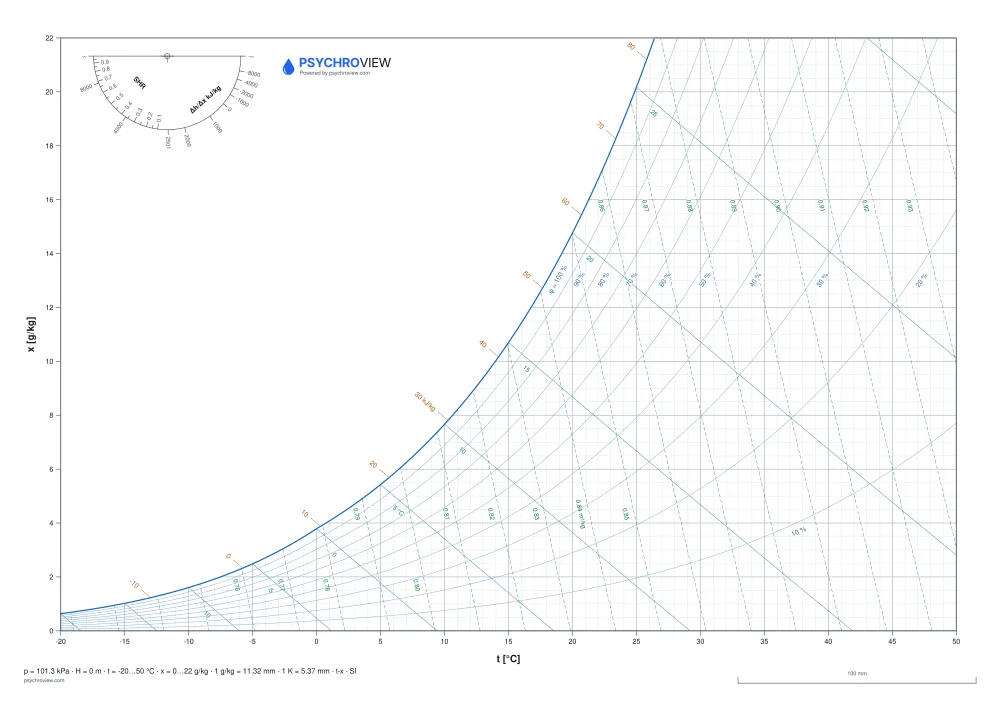
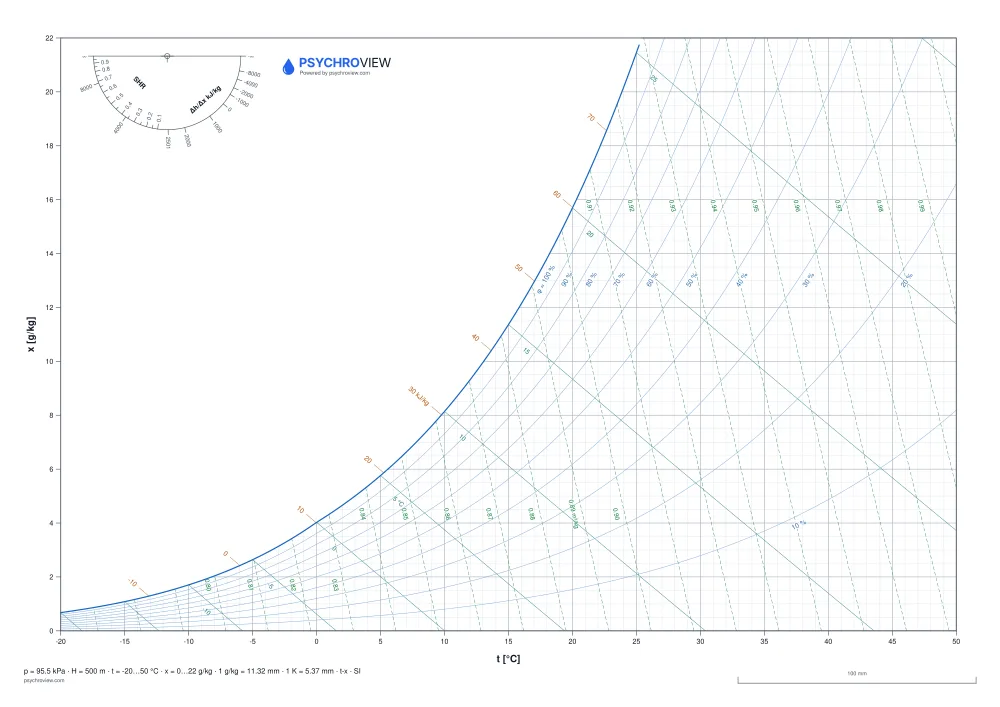
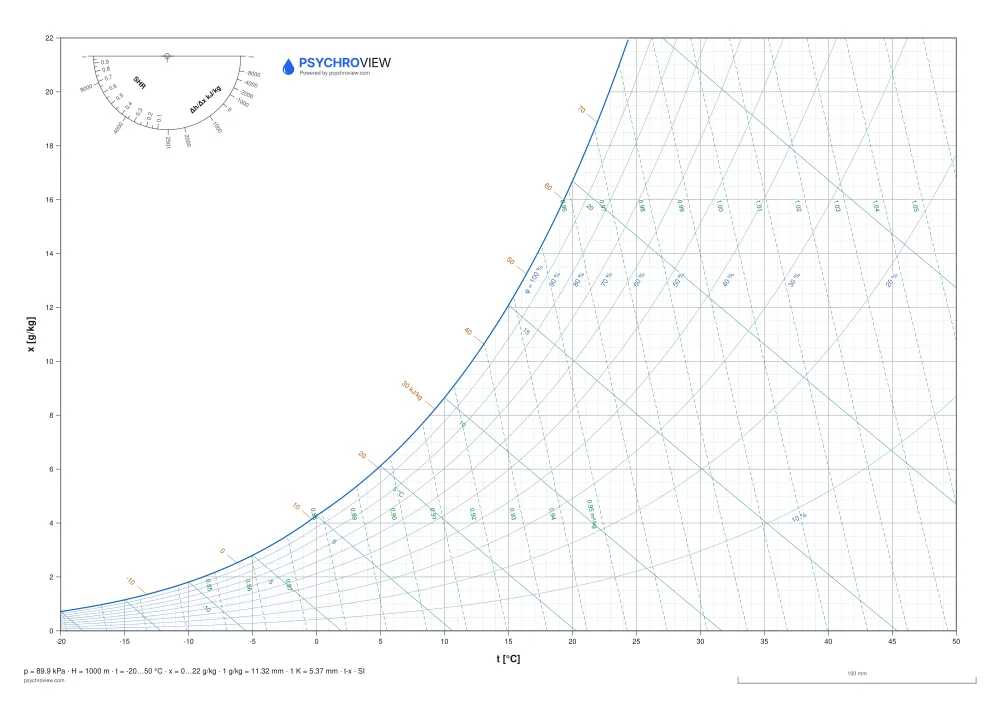
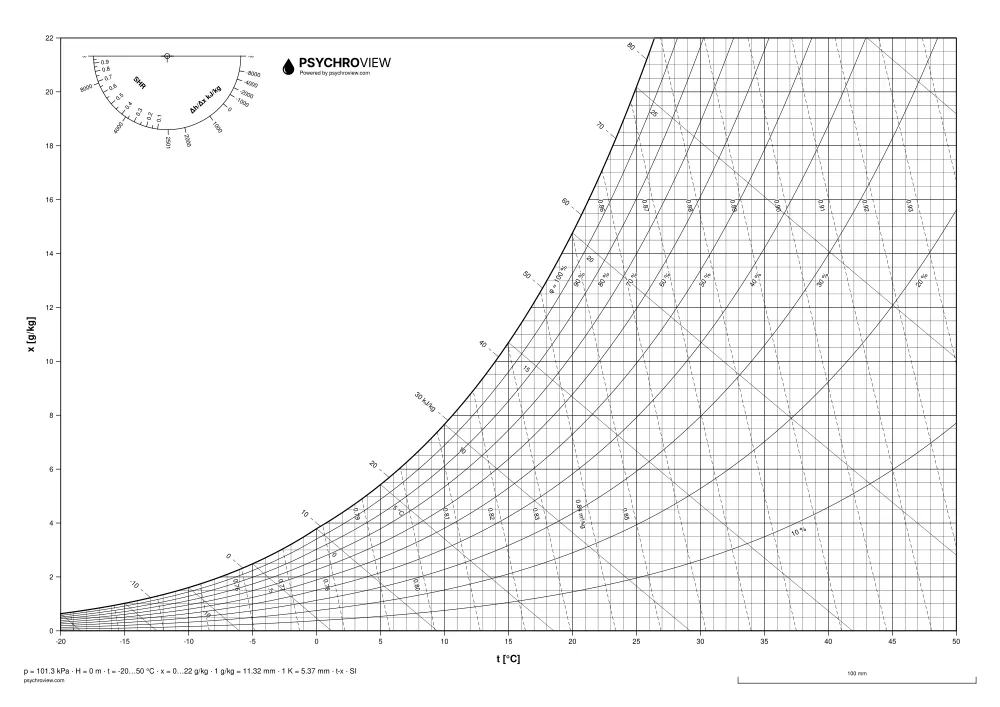
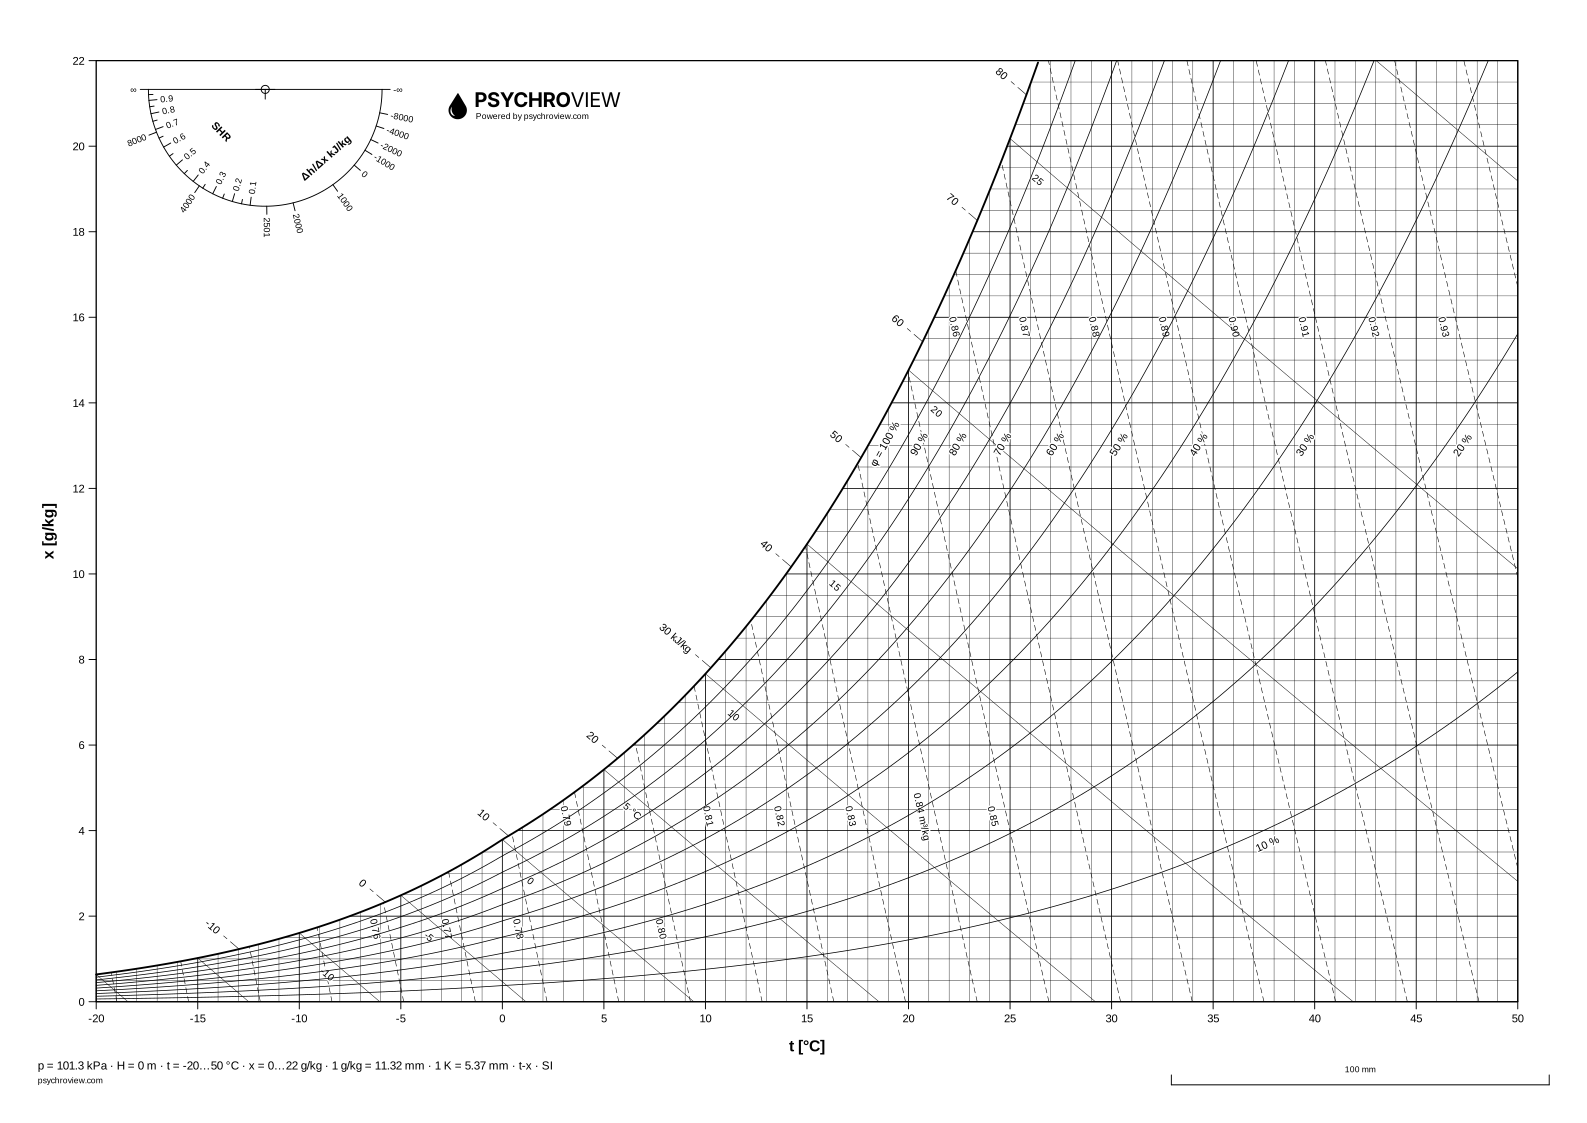
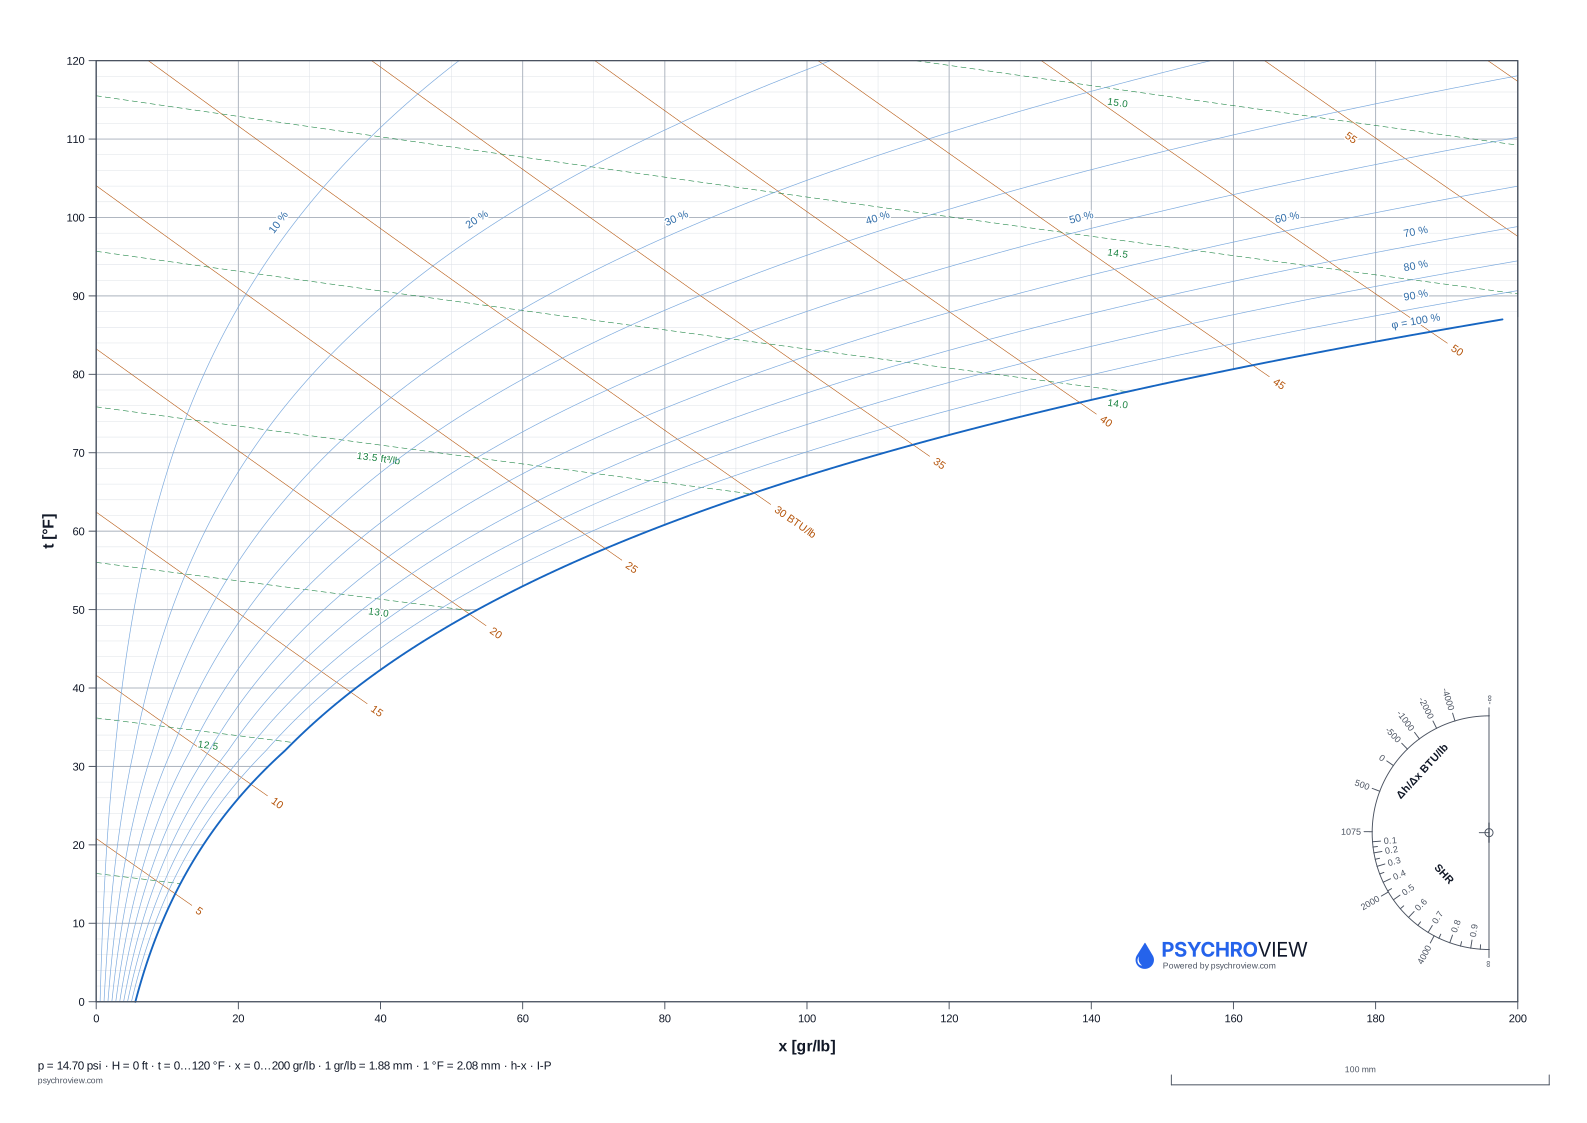
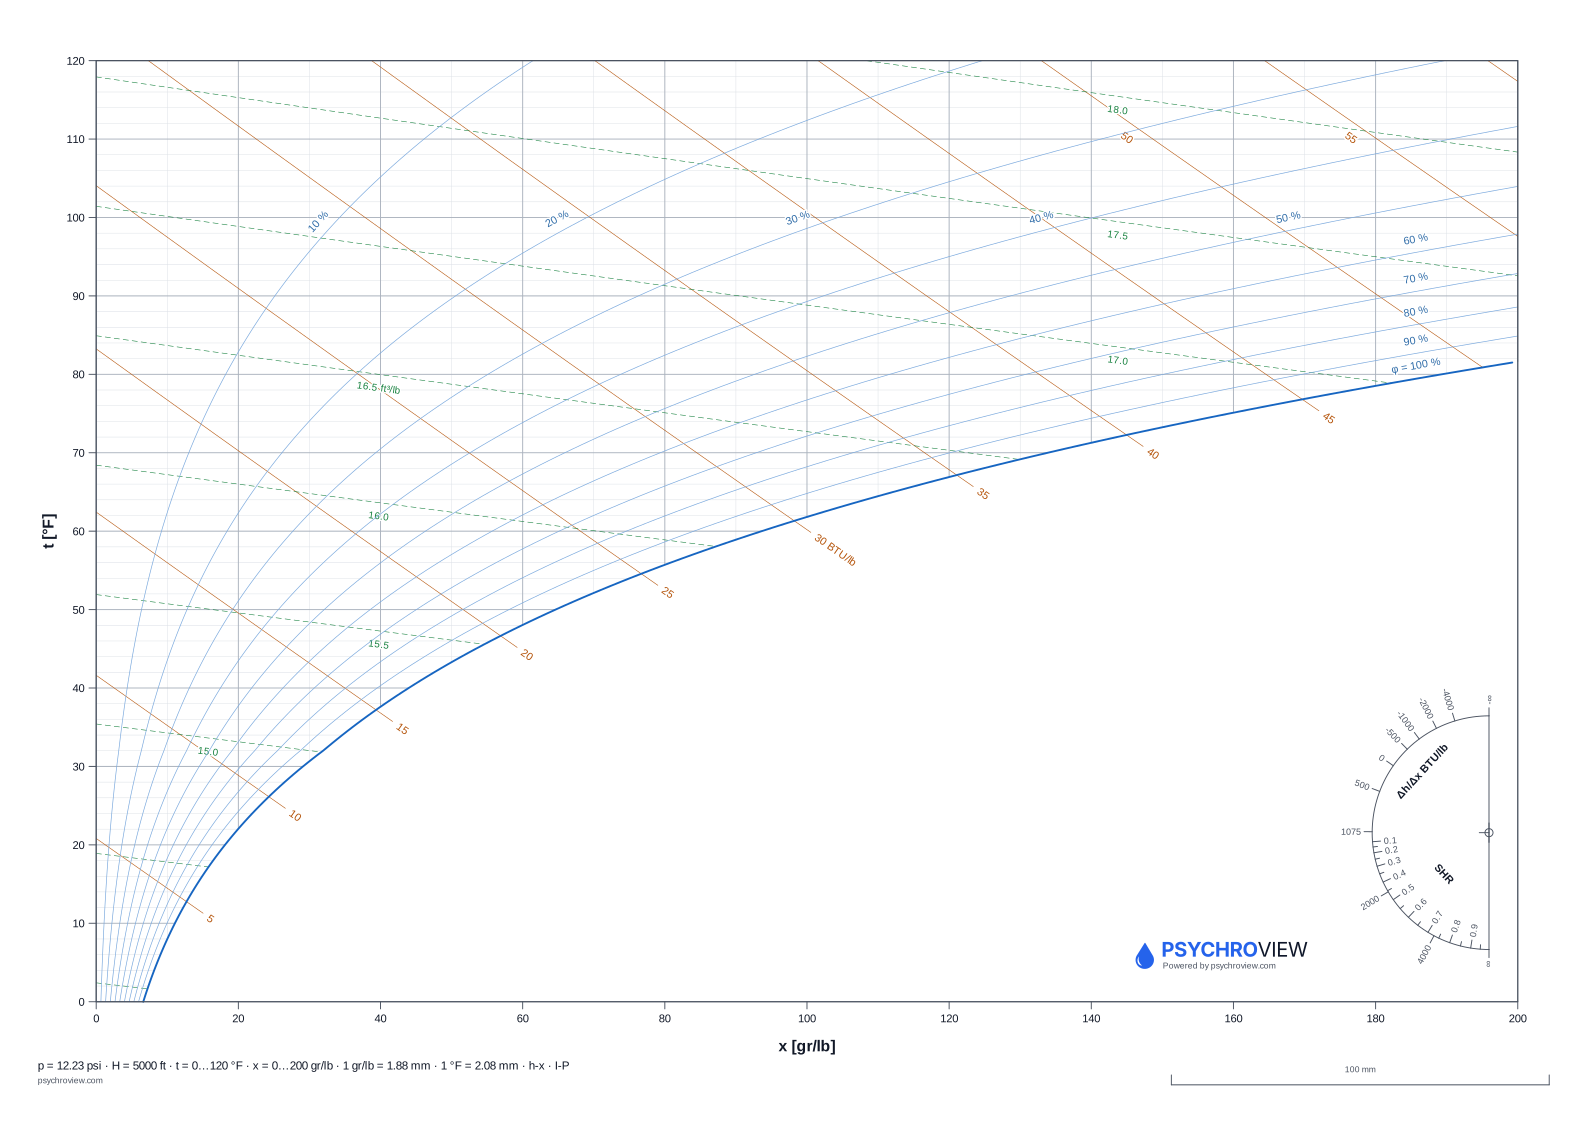
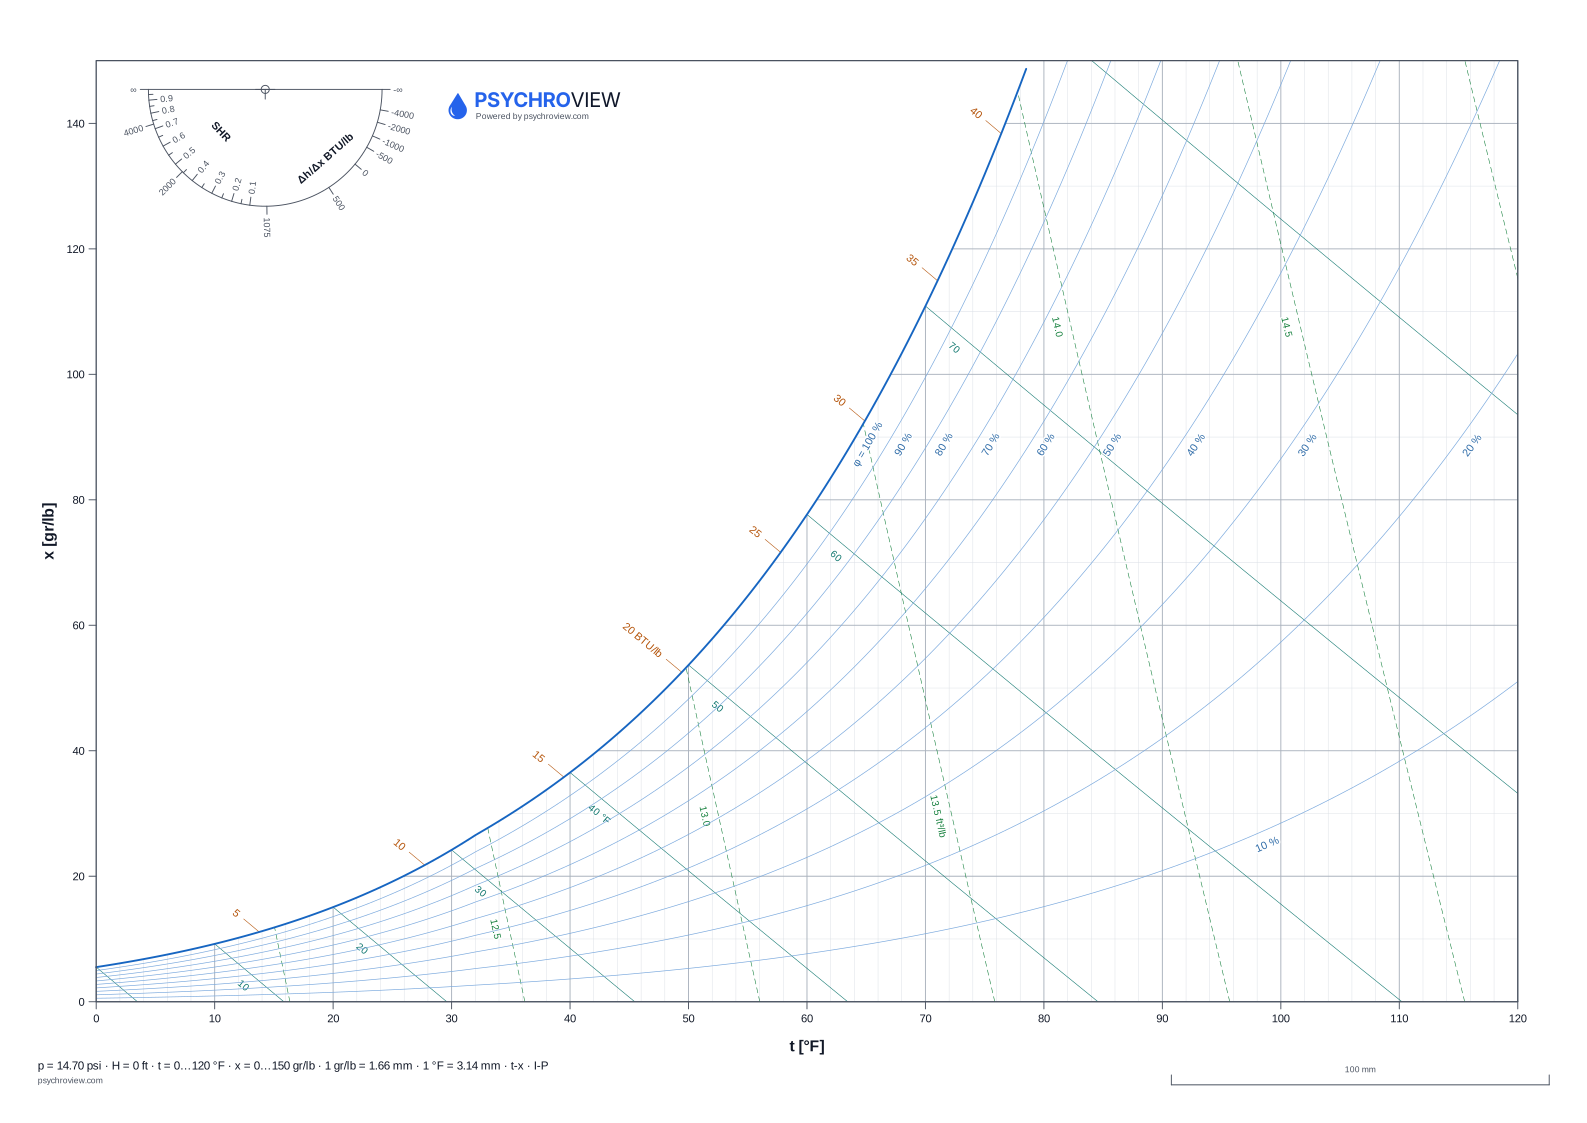
The same blank charts as the PDFs, but as a drawing you can insert into your project, switch off what gets in the way, and draw your process on your own layer.
Download DXF
Thirteen variants, DXF R12, drawn 1:1 in millimetres. The sheet size is A3, but in CAD that only affects the frame and the footer strip — you print it in your own title block anyway.
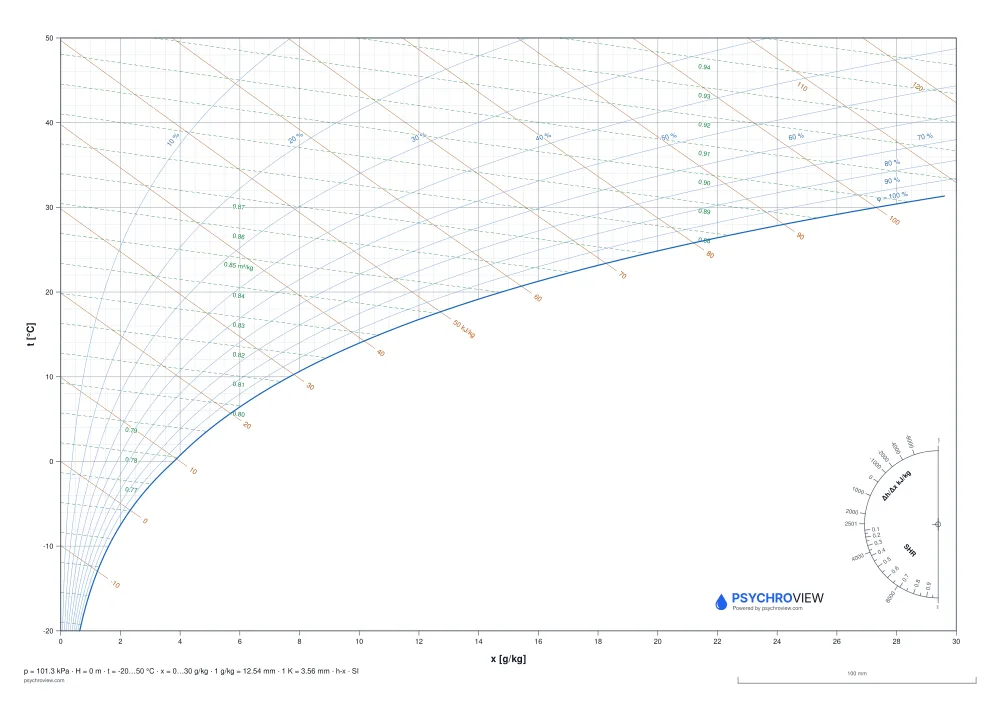
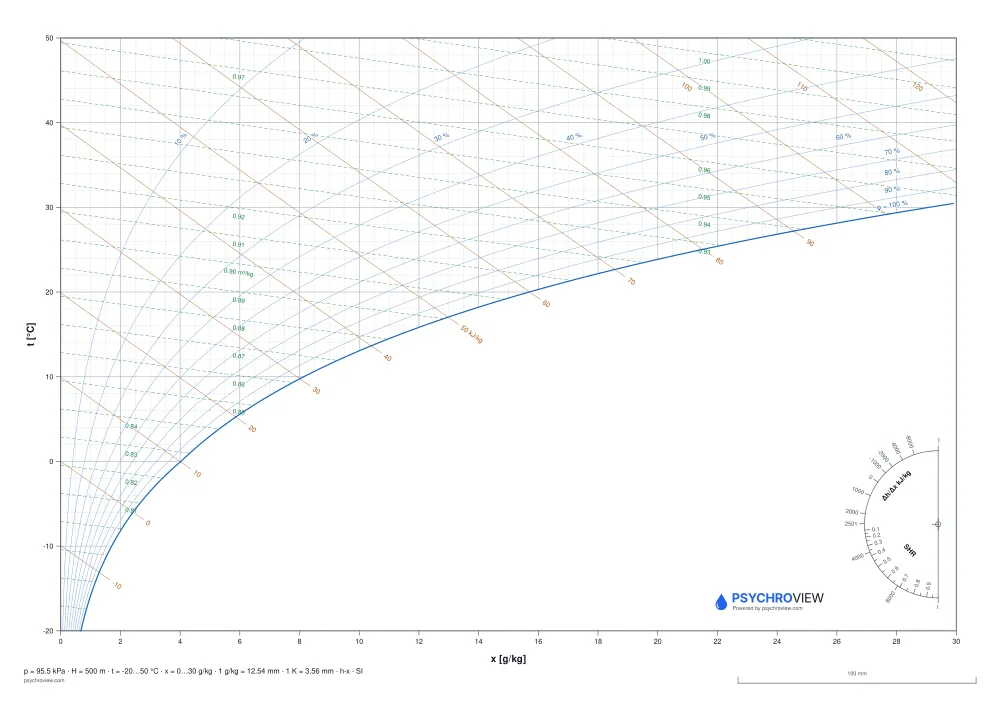
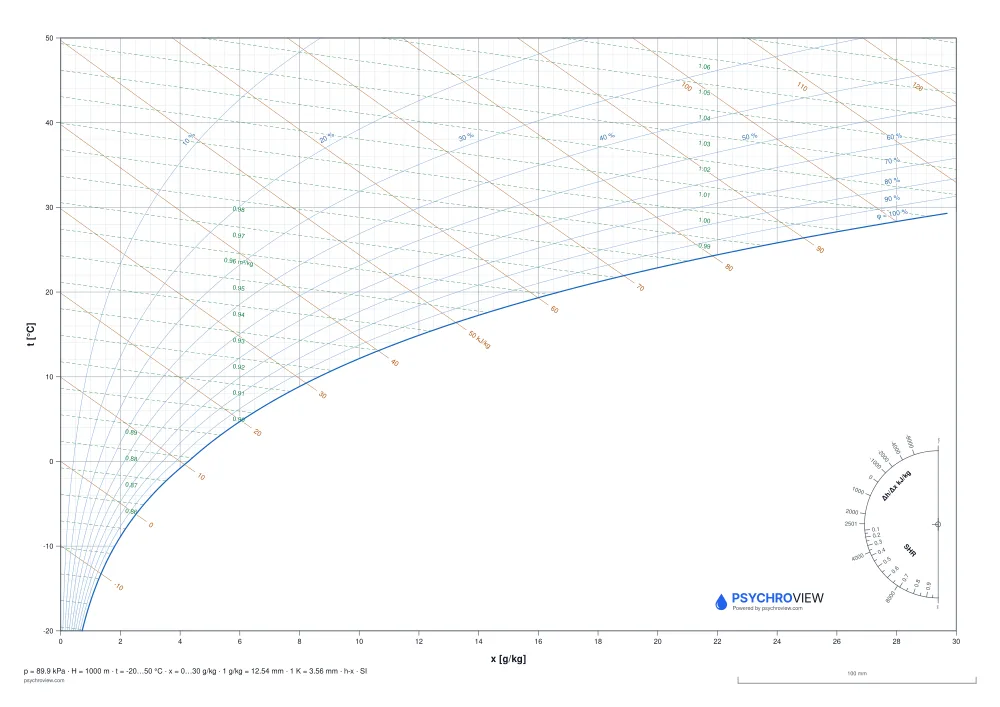
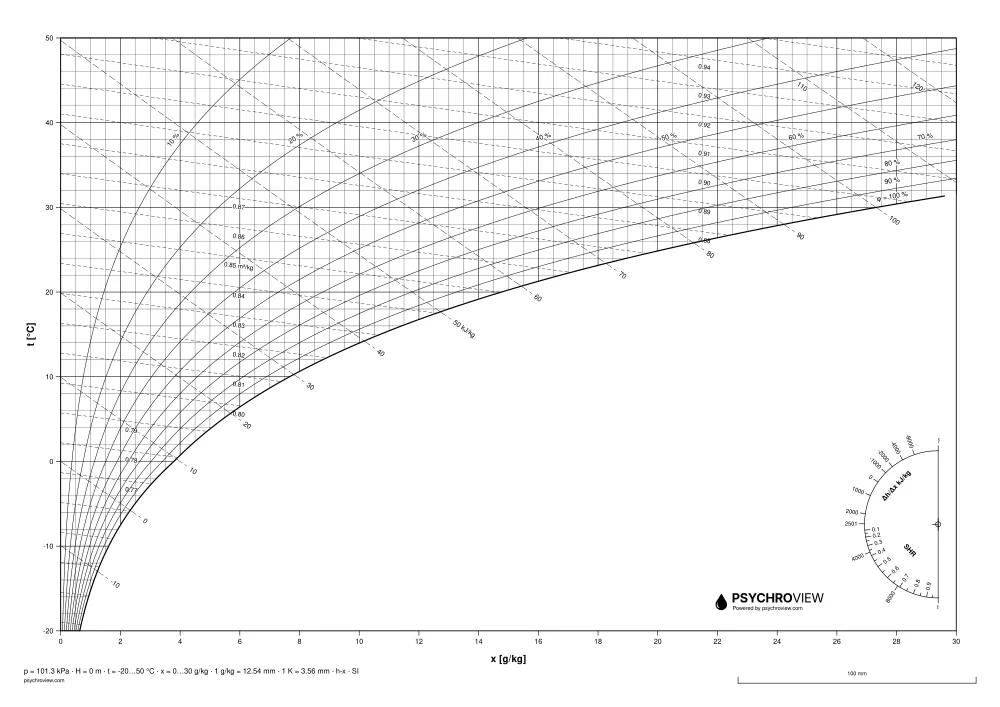
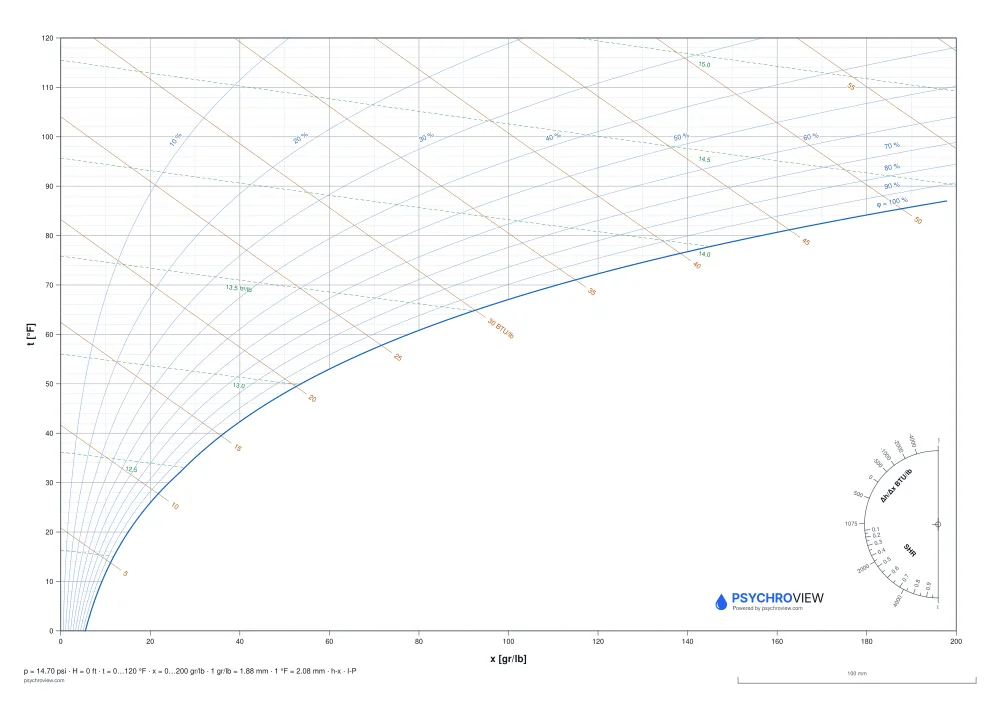
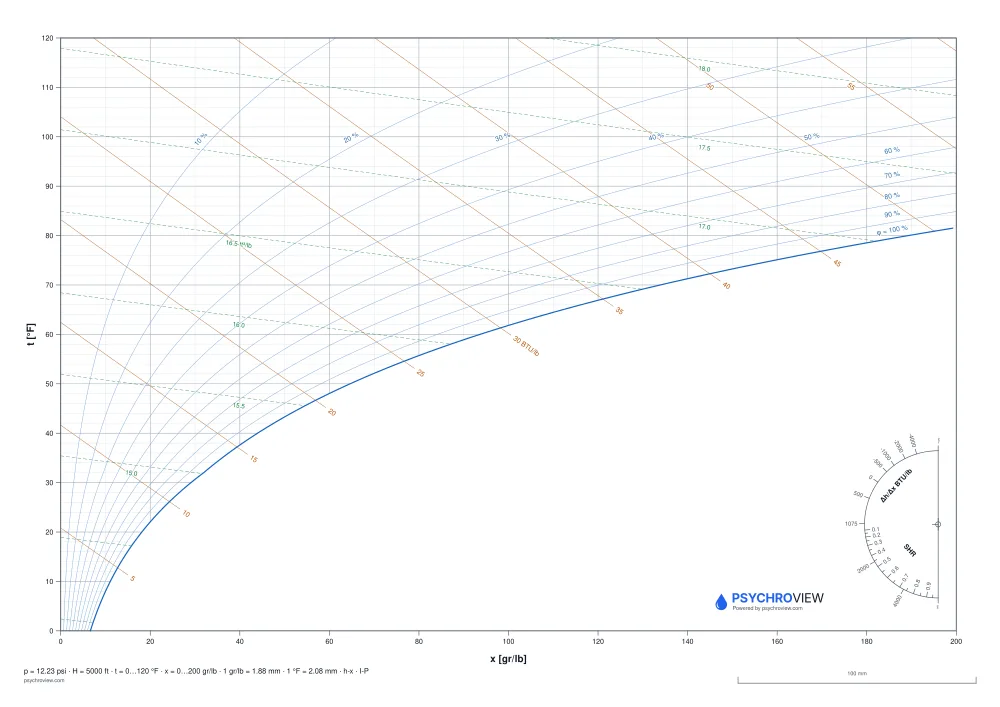
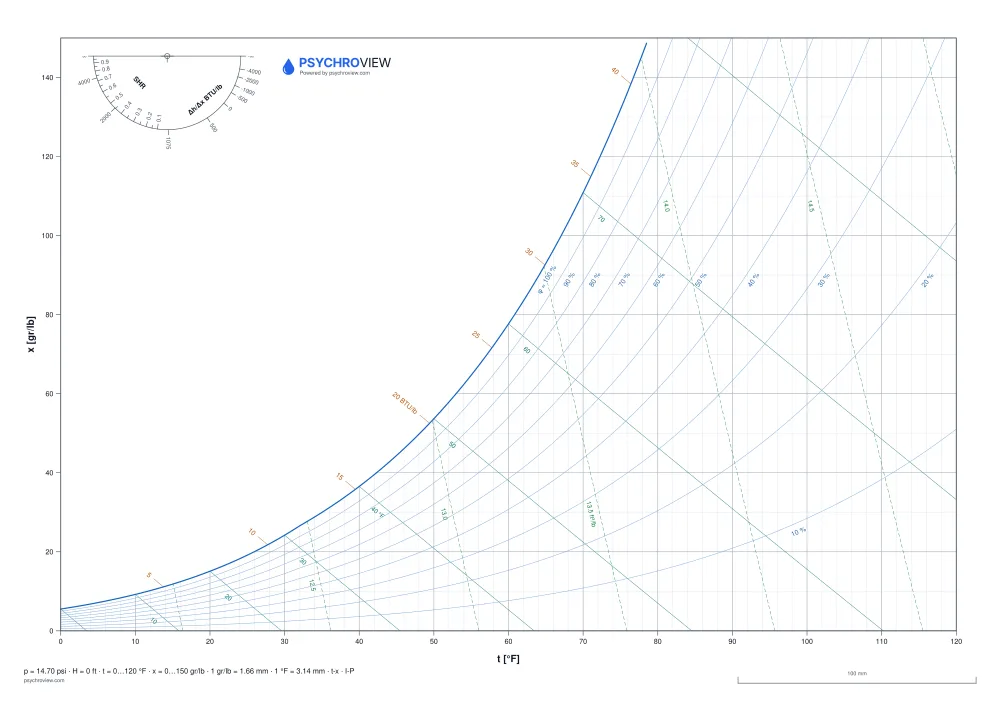
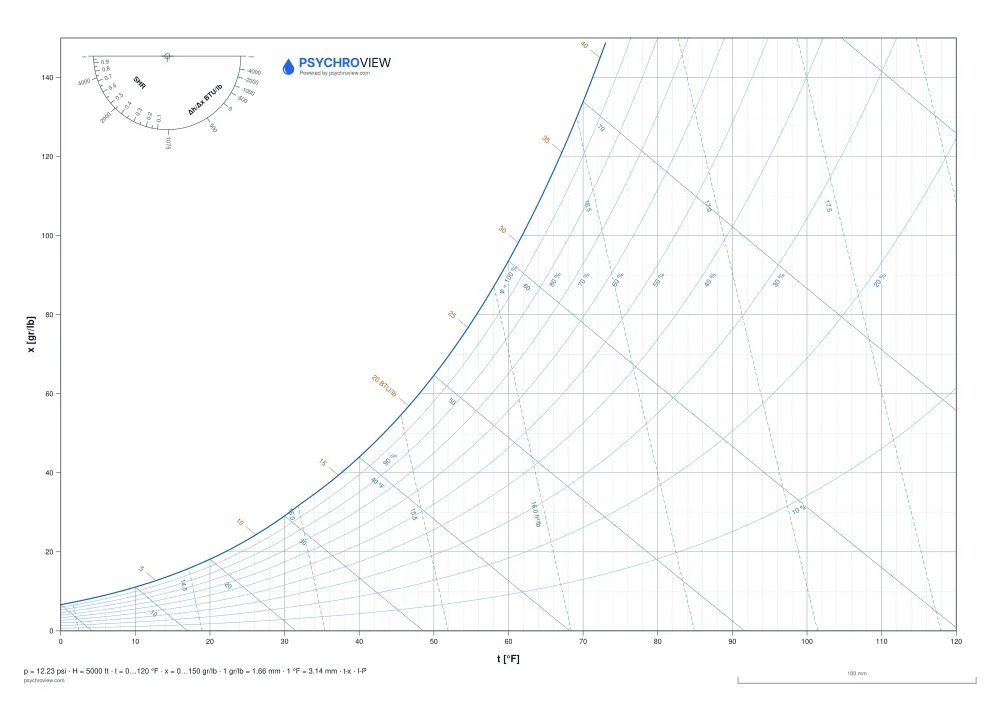
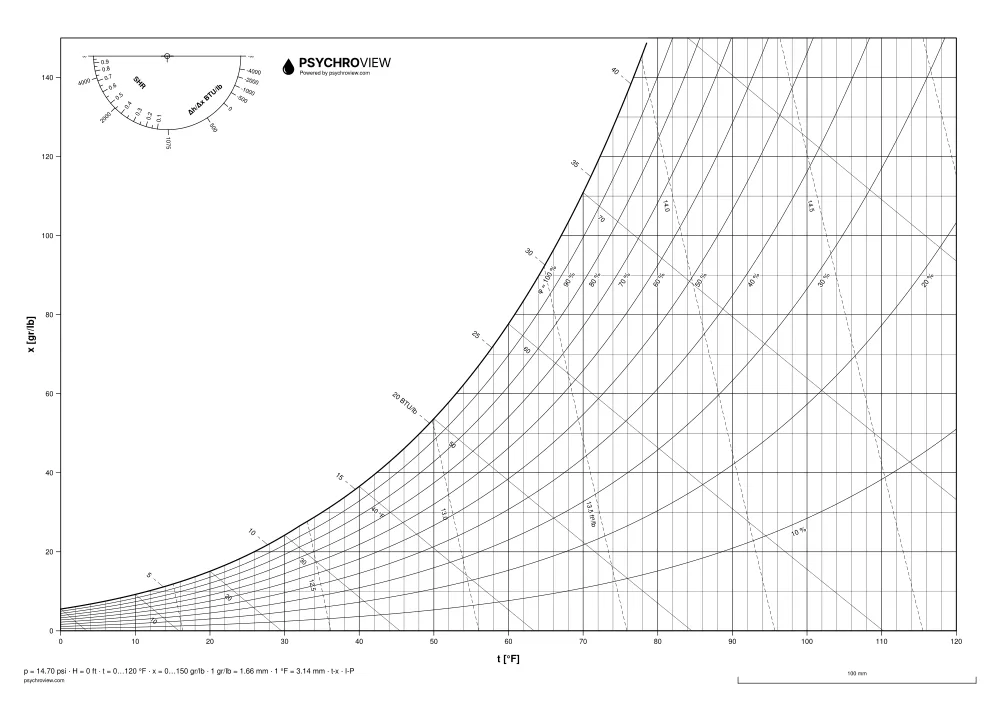
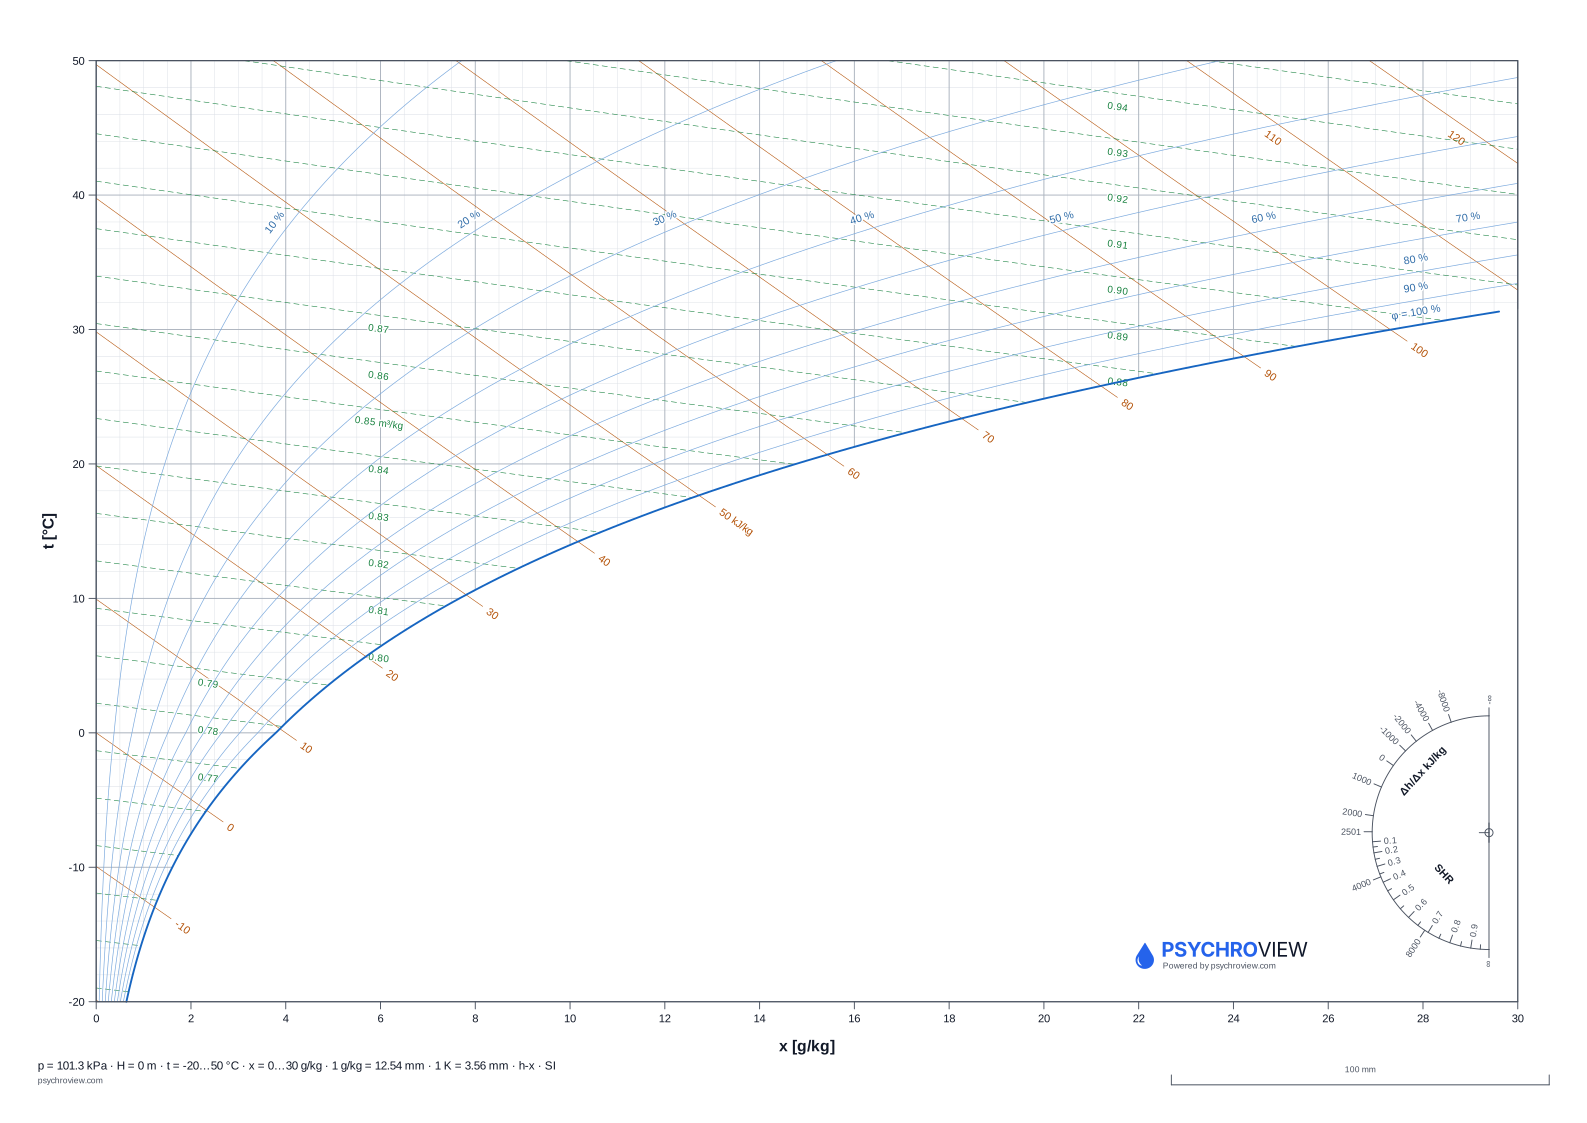
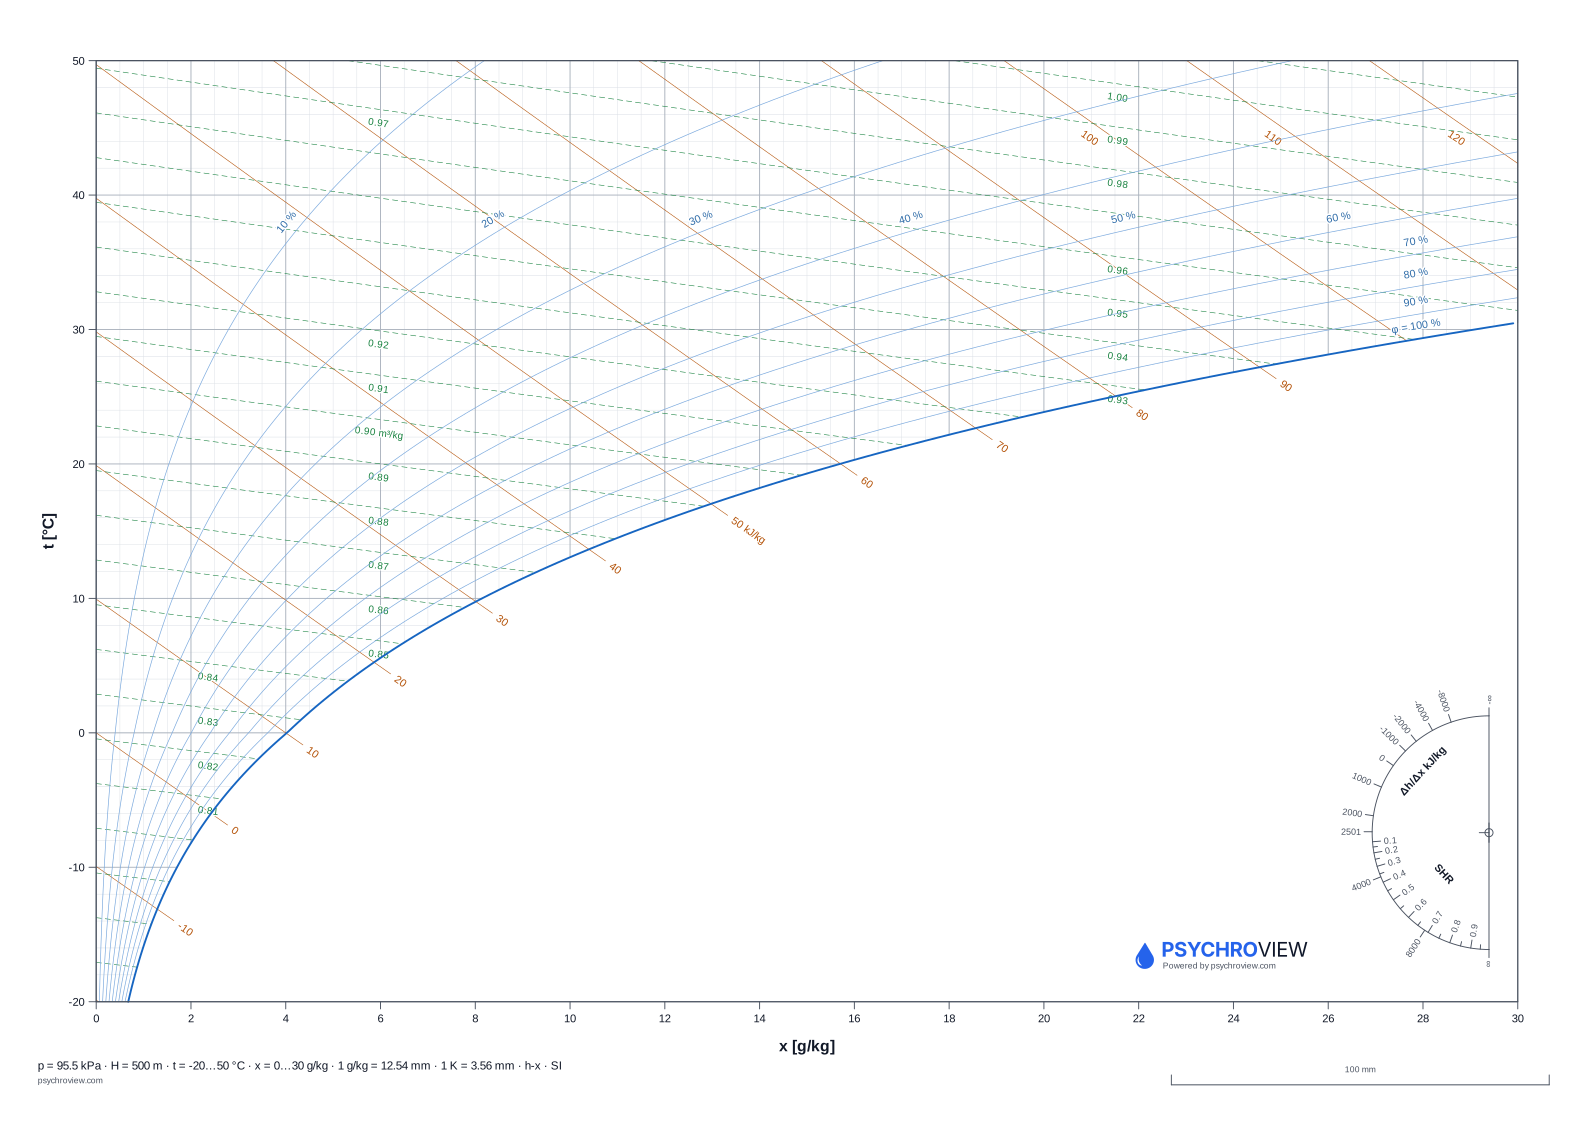
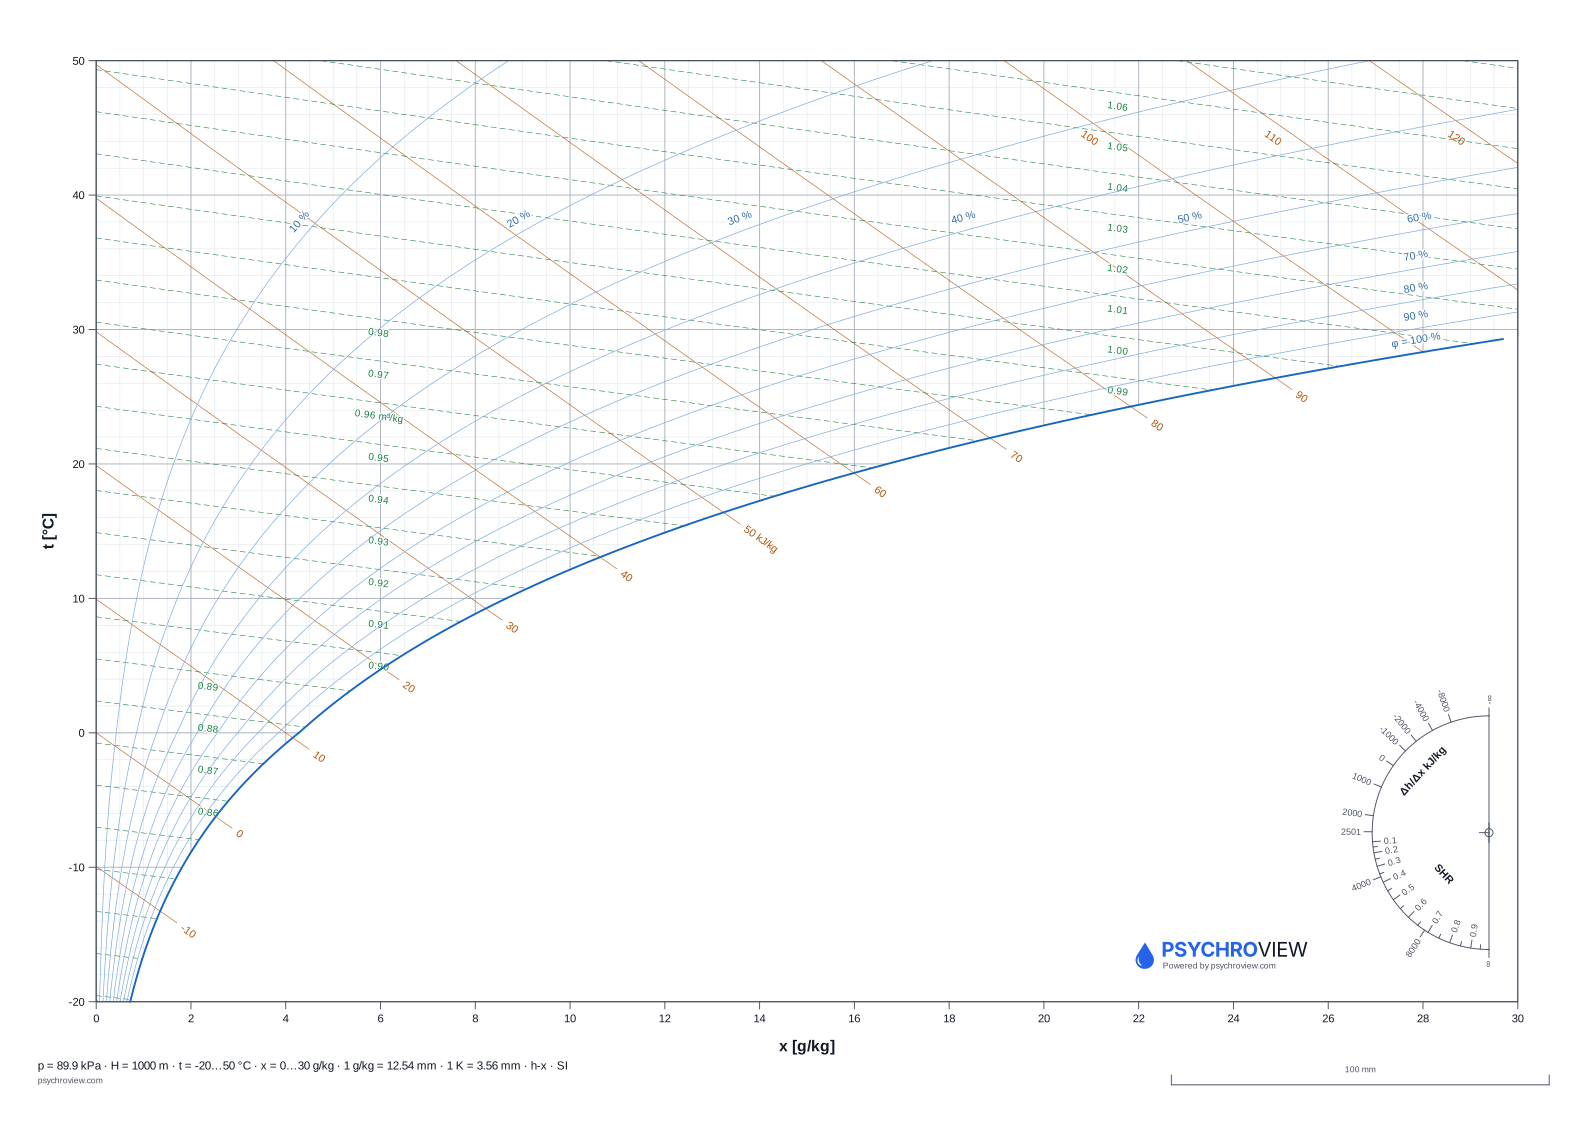
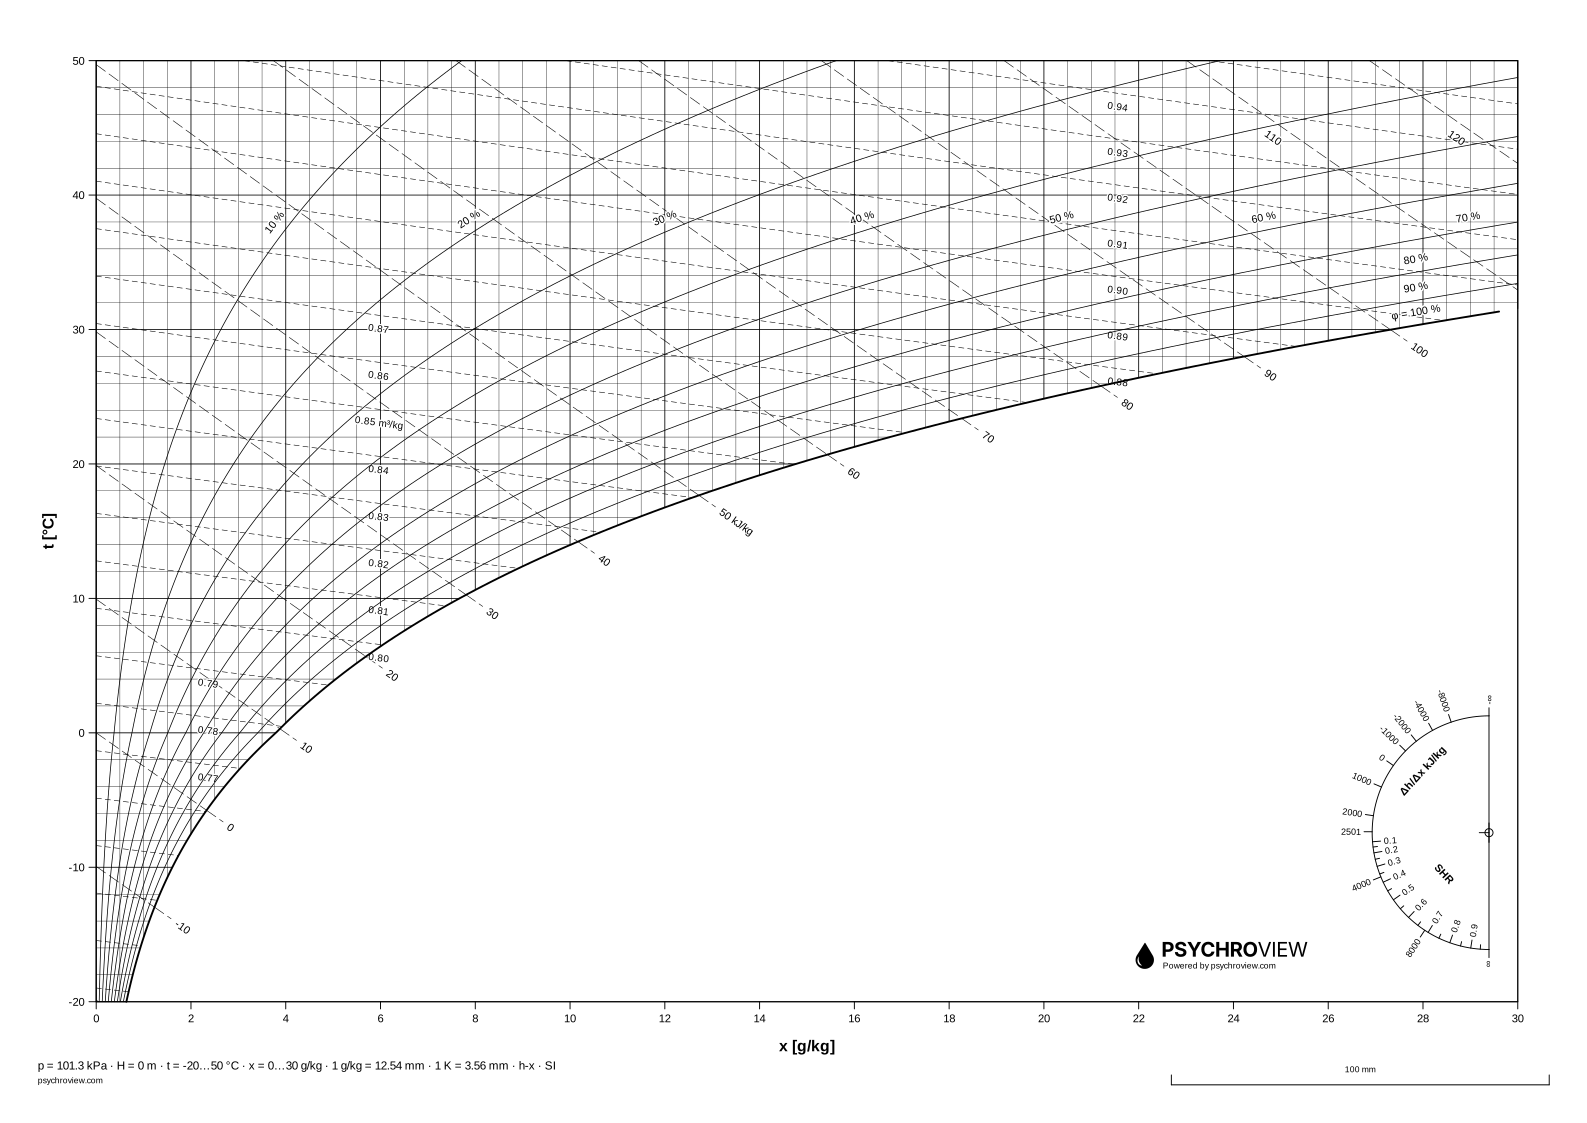
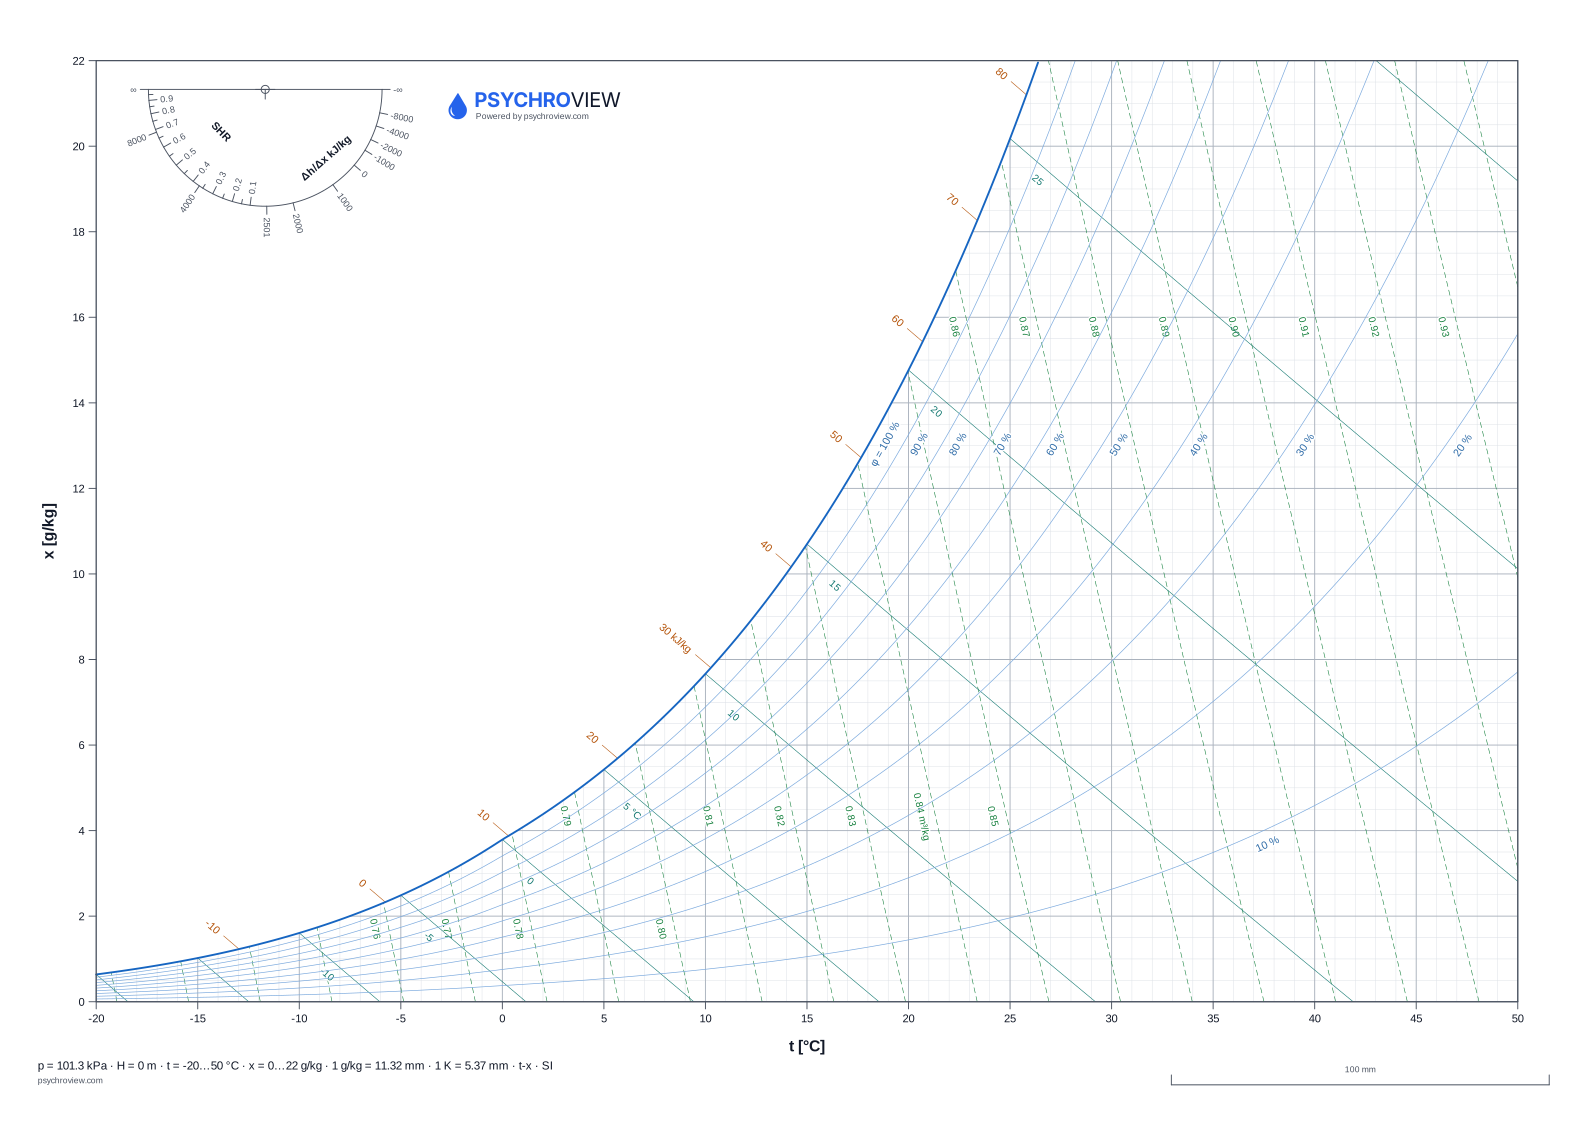
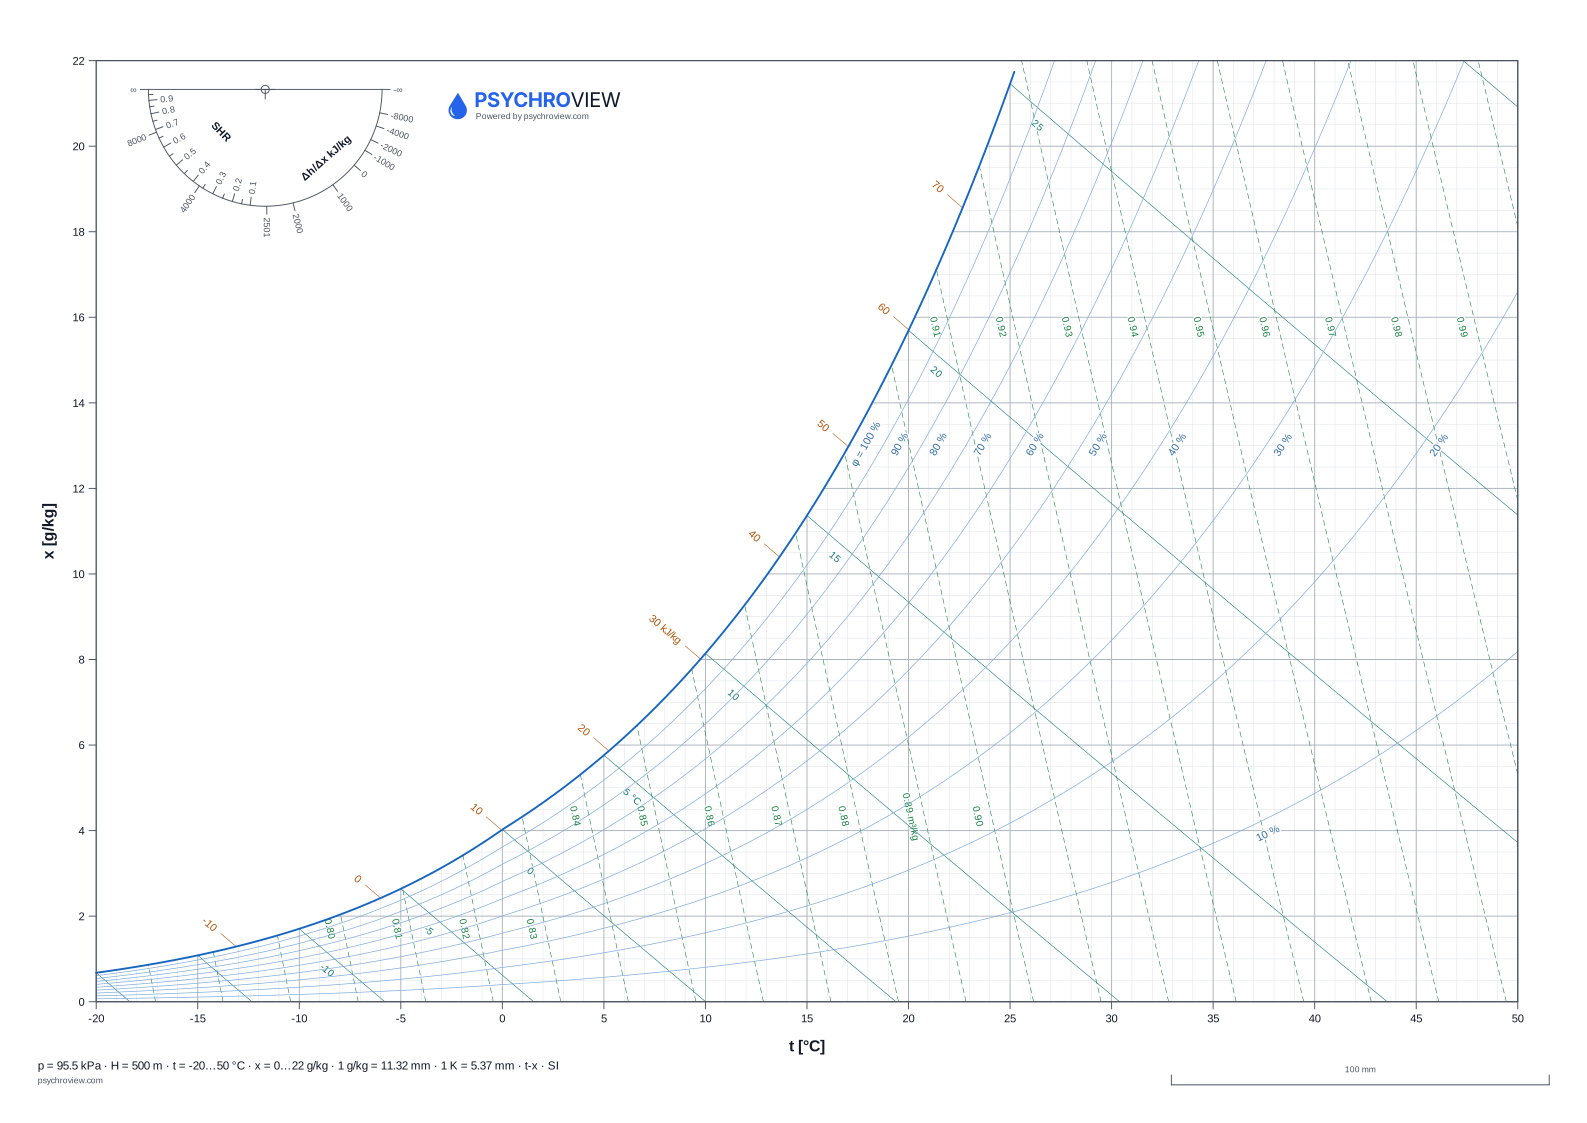
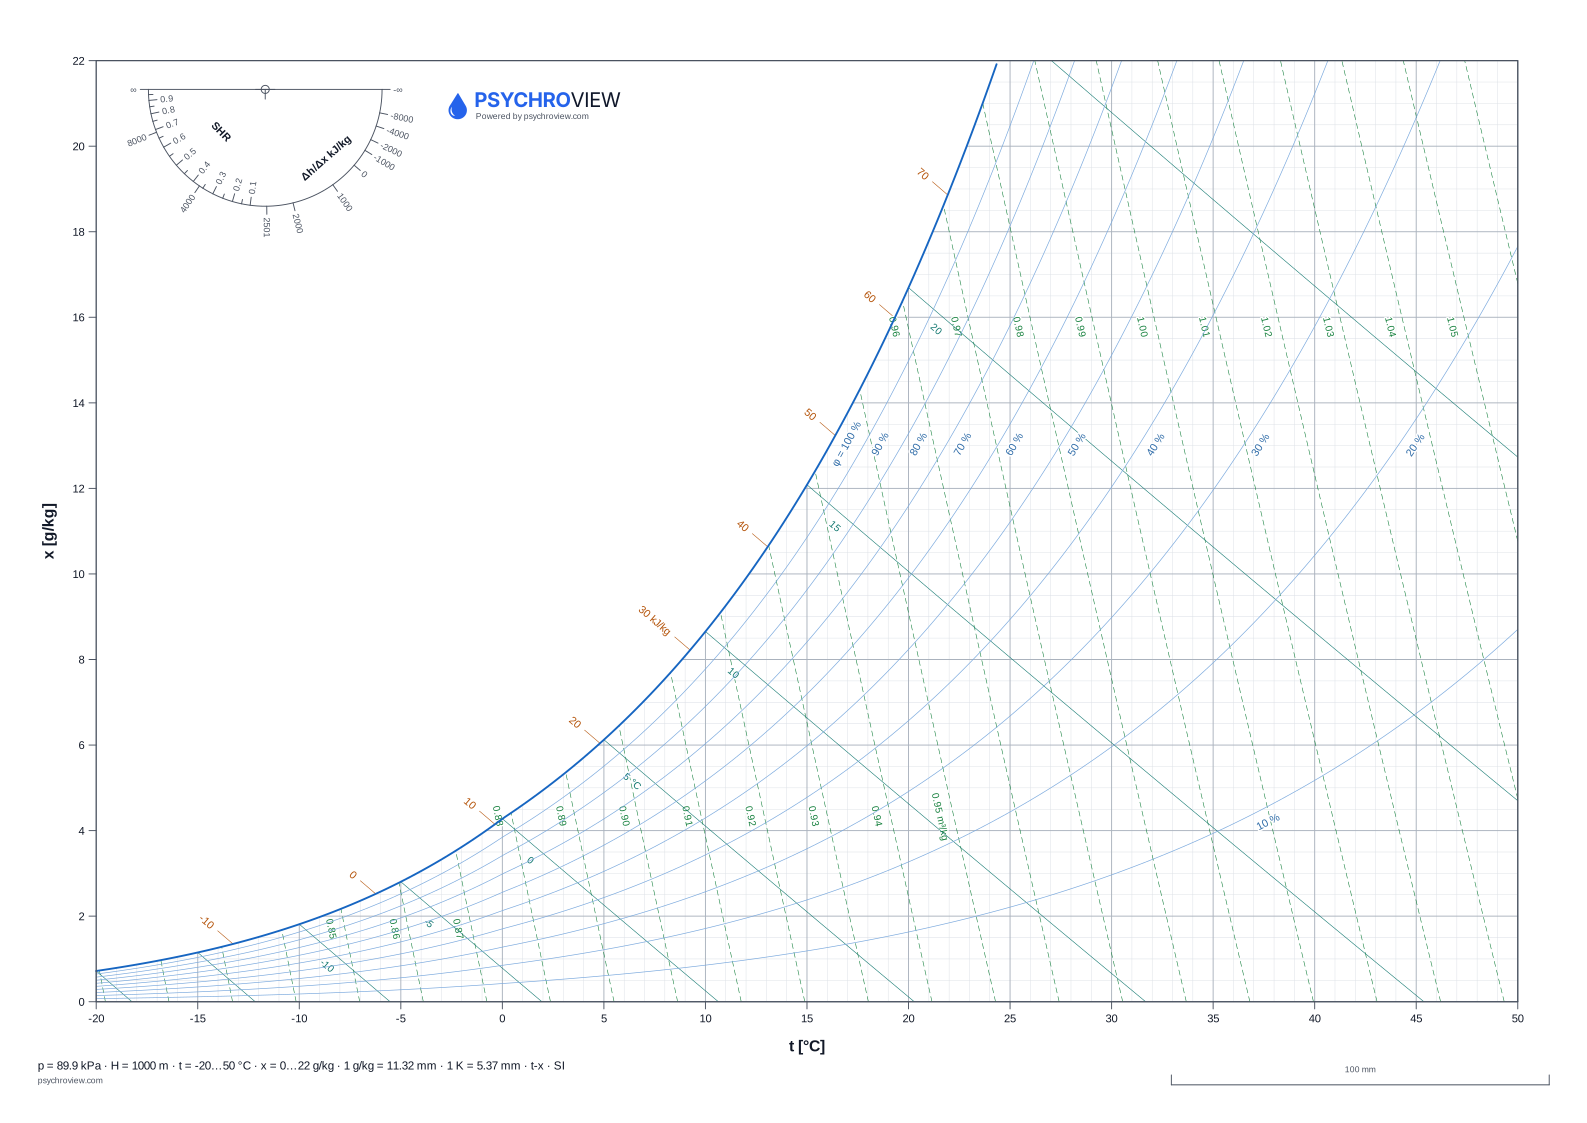
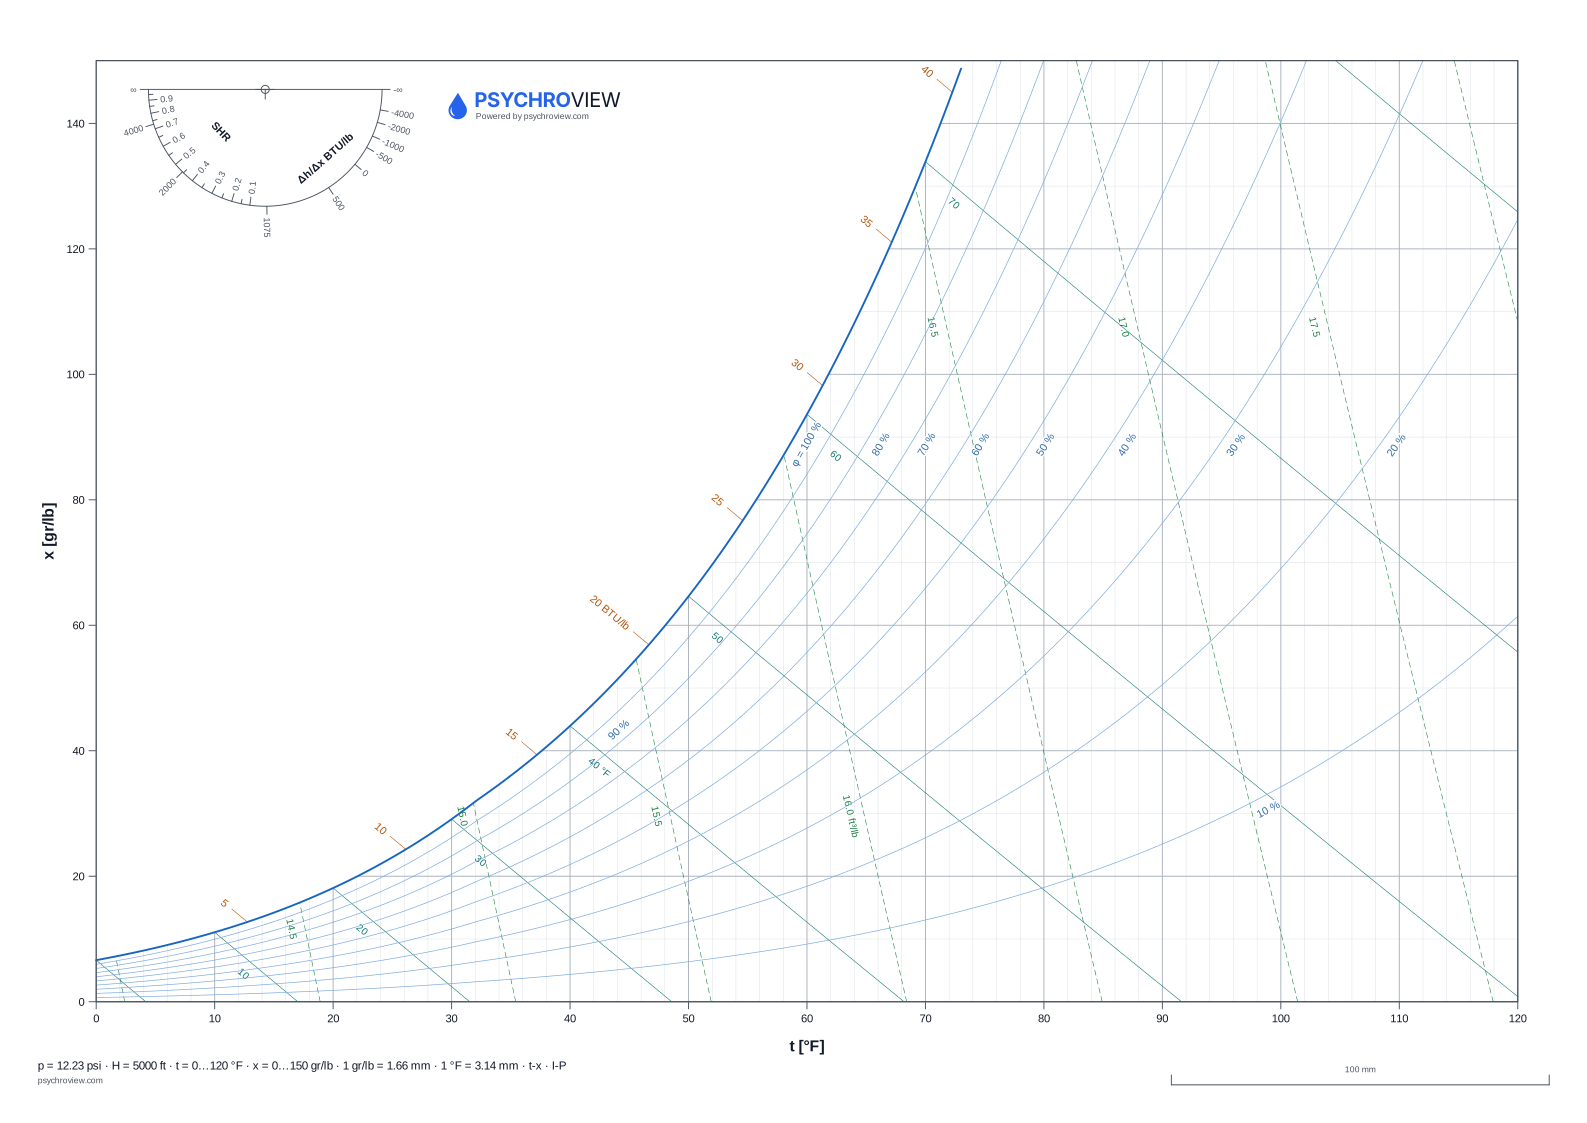
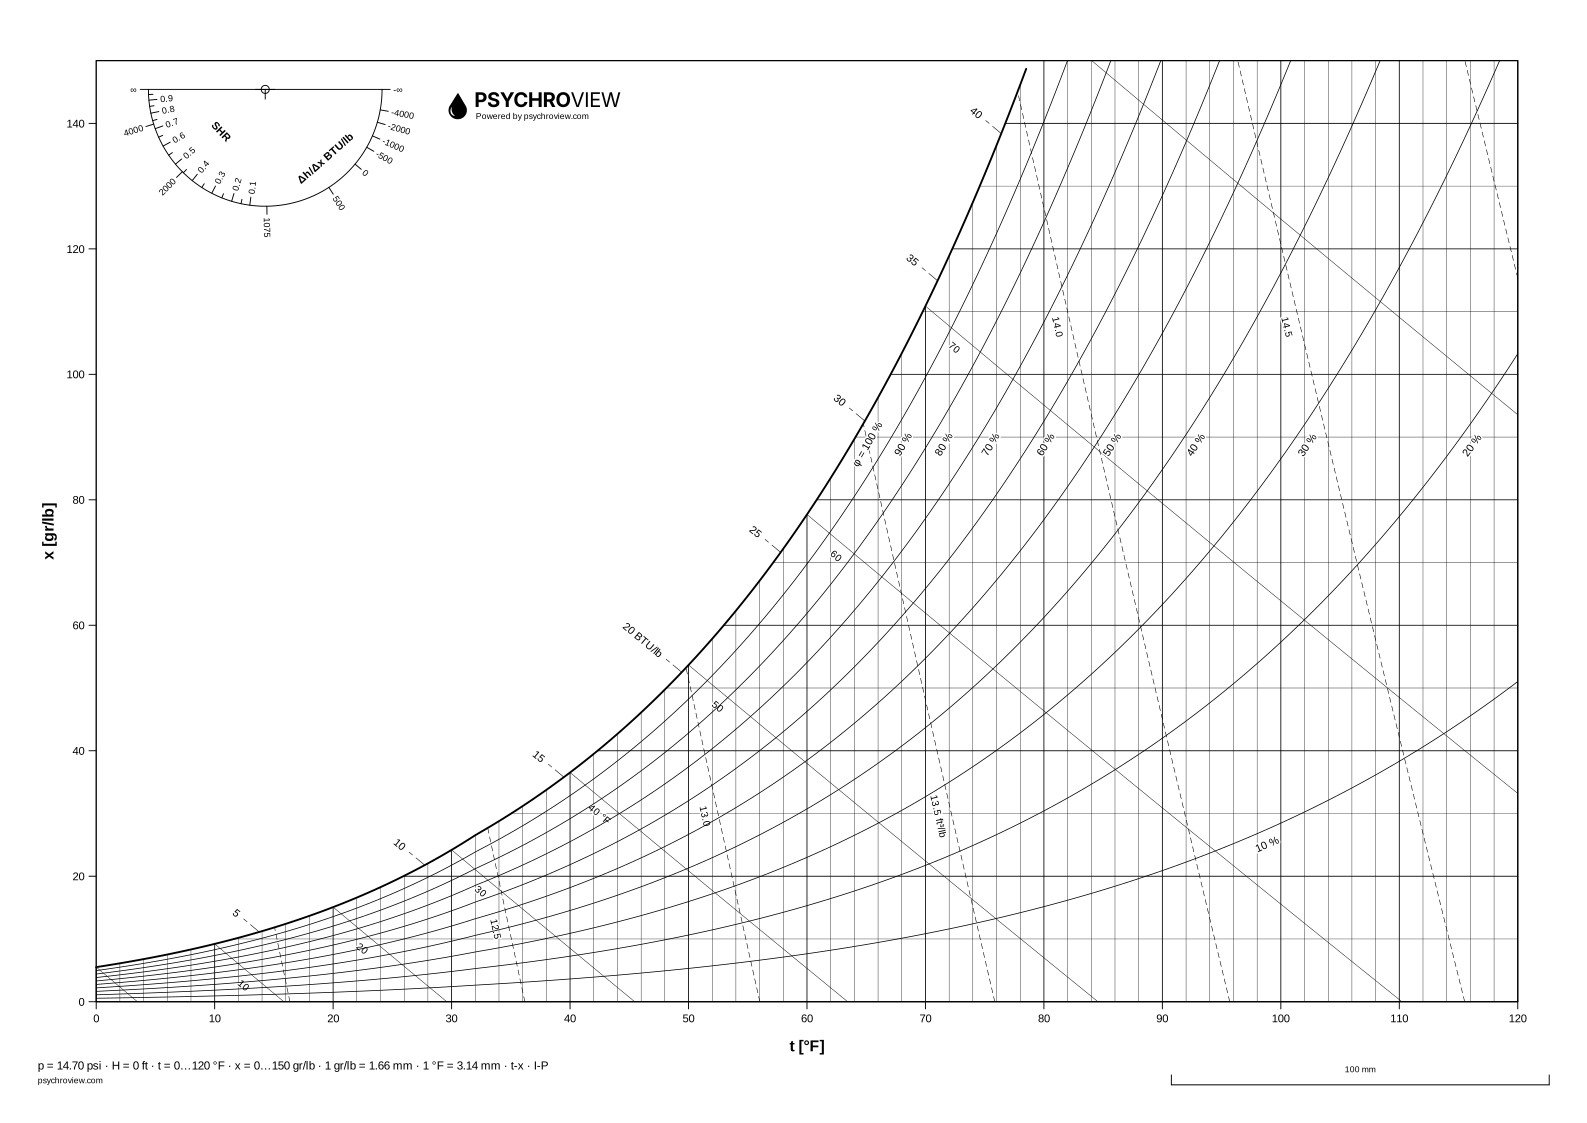
What is on which layer
This is what the DXF adds over the SVG: everything sits on a named layer, so you can turn off what you do not need. Labels are on their own layer, separate from the lines they belong to — switch off the isochores and their numbers go with them, while the axis labels stay.
| Layer | Contains |
|---|---|
| GRID-MINOR, GRID-MAJOR | Temperature and humidity ratio grid |
| FRAME, TICK | Plot frame and axis ticks |
| SATURATION | Saturation line φ = 100 % |
| RH, RH-TEXT | Relative humidity curves and their labels |
| ENTHALPY, ENTHALPY-TEXT | Enthalpy lines and their scale |
| VOLUME, VOLUME-TEXT | Specific volume lines and their labels |
| WETBULB, WETBULB-TEXT | Wet-bulb temperature lines and their scale |
| PROTRACTOR, PROTRACTOR-TEXT | Δh/Δx and SHR protractor |
| AXIS-TEXT | Axis tick labels and axis titles |
| STAMP, STAMP-TEXT | Footer strip: boundary conditions and the 100 mm check line |
| BRANDING | Mark (outline only — see below) |
Colors are set on the layer (ByLayer), not on the entities, so you can recolor the whole background with one click.
1 drawing unit = 1 mm
The chart is drawn 1:1 in millimetres and the file declares millimetres as its unit ($INSUNITS = 4). Insert it into a drawing in millimetres and the scale matches with nothing to compute.
The footer strip carries a 100 mm check line. If it measures 100 mm in your CAD, nothing rescaled the drawing on the way in.
What the file does not carry
Line weights. DXF R12 predates them — a line weight is a property that only exists from R2000 on. The drawing is a set of hairlines and you set the weights yourself, per layer. Take it as a feature: your own drawing standard wins over ours.
Fills. The mark is an outline. A filled shape would mean a hatch with islands for a logo 5 mm tall.
Greek letters and symbols. R12 is a pre-Unicode format, so φ is written phi, m³/kg as m3/kg and Δh/Δx as dh/dx. Degrees use the native R12 code, so °C comes out right everywhere. Without this the text would land as question marks in most free CAD programs.
How to use it as a background
Insert the file into your drawing, lock the layers you want to keep as reference, and add your own layer for the process. That way your work stays separate from the chart and you can switch the chart off entirely for a clean plot.
If you only need the working area, switch off STAMP, STAMP-TEXT and BRANDING. Nothing else depends on them.
Which programs open it
The files are DXF R12 (AC1009), deliberately the oldest widely-supported version: AutoCAD, BricsCAD, DraftSight, LibreCAD, QCAD and FreeCAD all read it. Newer versions would give smaller files and true line weights, but would shut out exactly the free tools that a smaller practice actually has.
Where the background ends. A DXF is a grid — you draw the lines into it yourself, on your own layer. If the drawing is also meant to carry the calculated states, the application exports a DXF with the processes and points already drawn in, in the same layer structure.
Questions about the DXF
Can I use the chart in my own project documentation? +
Yes — that is what it is for. Insert the drawing into your documentation, draw on it and print it in your own title block, including commercial work. What you may not do is sell the files themselves or pass them on as your own with the source identification stripped out.
Why are the lines all the same weight? +
DXF R12 does not carry line weights; they arrived with R2000. Set them per layer in your CAD — the drawing is split into named layers precisely so that this takes a moment.
Is there a DWG version? +
No. DWG is a closed format and would need a third-party library. Every program that opens DWG also opens DXF.
Can I get a chart for a different altitude or range? +
Yes. The generator on the downloads hub offers DXF for any boundary conditions you set, not just the twelve prepared variants.
Does the file contain the processes from the app? +
No, it is a blank chart — grid, curves, scales and the protractor. Drawing processes is what the application is for.